Feed Aram Bartholl [copy] http://datenform.de/blog/feed/ has loading error: A feed could not be found at `http://datenform.de/blog/feed/`; the status code is `200` and content-type is `text/html; charset=UTF-8`
Feed Cem TEZCAN [copy] https://yewtu.be/feed/channel/UCGcjzzEmGThh35eeDkvydeg has loading error: cURL error 22: The requested URL returned error: 403
Feed Centsational Style [copy] https://centsationalstyle.com/feed/ has loading error: A feed could not be found at `https://centsationalstyle.com/feed/`; the status code is `200` and content-type is `text/html; charset=UTF-8`
Feed designboom magazine [copy] http://shalnoff.co.uk/rss.php?rss=designboom has loading error: cURL error 22: The requested URL returned error: 403 Forbidden
Feed Kinote.info [copy] http://kinote.info/sections/blog/articles.xml has loading error: http://kinote.info/sections/blog/articles.xml is invalid XML, likely due to invalid characters. XML error: Invalid document end at line 1031, column 7
Using Blender Subsurfaces from Python
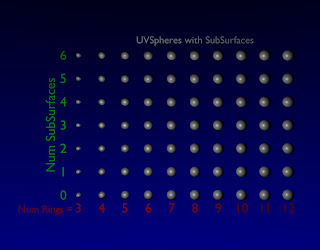
In Blender, one of the ways to improve the smoothness of an object is to use subsurfaces. Programatically, this is done by changing the modifiers attached to an object. In this example, a UVsphere is modified by changing the number of rings and segments. The same basic UVsphere is also modified by adding subsurface levels. From looking at the table, it is possible to see how increasing subsurface level and rings/segments both get a smooth looking sphere.
To get this example to run, you will need to copy the Data Origami Library rev 0.001 to C:\tmp (or modify the path to...
 dataorigami.blogspot.co.uk
Interesting Travel Dataset
![]()
I was looking at NavIt, an open source mapping and routing package. They use the Open Street Map for one source database. The interesting thing buried in the Open Street Map project is over a quarter of a million XML source data traces which includes location and time stamps uploaded by users.
dataorigami.blogspot.co.uk
Interesting Dataset: Residential Energy Consumption Survey
This is an interesting dataset which illustrates the energy usage in US households annually. 2005 Residential Energy Consumption Suvey
dataorigami.blogspot.co.uk
How to draw a curve in Blender using Python - A Quick-N-Dirty Example

In a previous example, curves were generated using cylinder and spheres. This is computationally expensive and does not fully leverage Blender's capabilities. Rather than building curves using primitive meshes, the Blender.Curve objects can be used. This example demonstrates a simple script which creates a curve in 3D using Blender curves.
Code:
Download Code
#!BPY __doc__ = """ curveTest_xxxx.py Rev 1.0 The purpose of this script is to demonstrate the use of blender curves. This script is executed at the command line by: >blender -P curveTest_xxxx.py """ __author__ = "edt" __version__ = "1.0 2009/07/19" __url__="Website, dataOrigami.blogspot.com" ############################################################## # load the modules used in the script from Blender import Curve, Object, Scene from Blender.Scene import Render from...Posted at 2009-07-19 14:47:00 | Art_and_design | read on
Quick-N-Dirty: A rough example of an interactive data visualization in the Blender Game Engine
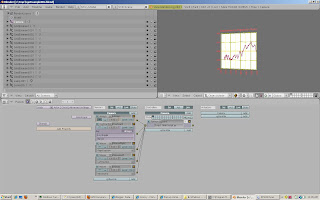
This example combines the Blender Game Engine example with the graphing example to allow simple navigation of the camera while looking at a graph. This example needs some fine tuning to improve the performance. The graph has too many elements to render quickly. However, it does demonstrate how to get all of the elements to work together in a data visualization. To run this example, construct the blender file described in this link. Save this file to the '\tmp' directory. Copy the code below to a python file and execute from the command line. For detailed instructions for each of these steps,...
dataorigami.blogspot.co.uk
How to size and place text in Blender using Python

This example shows how to size and place text arbitrarily in the Blender environment. The Blender API offers a function to size text, however, it is limited to a minimum range of '0.1'. For some applications this limitation is undesirable. This example includes a function, 'textInBox', which generates the text so that it fits in a box of given height and width. So the box can be arbitrarily sized, the function converts the text into a mesh, find the size of the mesh, then scales the text to fix in the box. One key aspect of this example which is...
dataorigami.blogspot.co.uk
Quick-N-Dirty: A graph with labels in Blender

This example shows how to generate a 2-D graph in Blender with a 3-D appearance. This example illustrates how to generate a graph from data,size and position text anywhere and of any size,delete (unlink) all elements from a scene including the default cube, lamp, and camera, andcombine multiple meshes into a single mesh.
The repetitive and complex tasks in the example are implemented using functions. To build a line segment in the graph curve in the graph, the function 'lineSegMe' generate a mesh tube that runs from one point to another. To generate a complex curve, these tubes are strung together using...
dataorigami.blogspot.co.uk
Quick & Dirty: Example of generating a graph in Blender
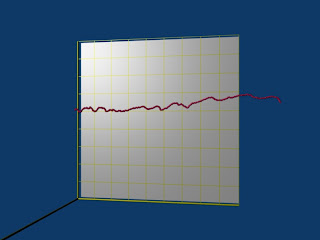
This is a quick posting. It demonstrates how to generate an x-y graph in Blender. Two functions are introduced so a curve can be generated from mesh primitives. The join method is used to combine the mesh primitives into a single object which is easy to edit and modify.
Code:
#!BPY __doc__ = """ SimplePlottingExample.py Example demonstrating the following techniques in Blender 2.48 to generate a plot of x-y data: 1) Joining meshes 2) Use of the transform matrix 3) Use of material properties to control how objects are rendered 4) Delete (unlink) of objects in a scene 5) Use of cross products to generate a basis for...Posted at 2009-06-22 04:26:00 | Art_and_design | read on
How to set the render path in Blender
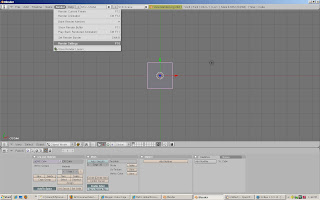
To set the location where renderings are saved in Blender do the following steps:
First, either press F10 or use the menus to select Render>Render Settings
Once you've done this, the panel at the bottom of the screen should show a collection of panels where the render settings can be changed. Select the text box which specifies where to save the rendered images.
dataorigami.blogspot.co.uk
How to easily copy code snippets from the formatted code display
When the code snippets are formated like this:
# code example
print 'Hello World!"
You can easily copy the text by clicking on the button in the upper right of the code block that is looks like <>. A popup will present the code without HTML or any other extra information. You can copy this to a clip board and paste the code into your favorite ide.
dataorigami.blogspot.co.uk